Step 5: Review Results
Chart displays every axis individually in the point to show the difference between the FMS and CMM data. It also shows how much its varying between the cycles

Difference Results: Select a point to preview the chart results in the Display.
Display Description: Shows the description for each point in the chart.
Print: Allows the results in the chart or display to be printed with a printer or to a PDF file.
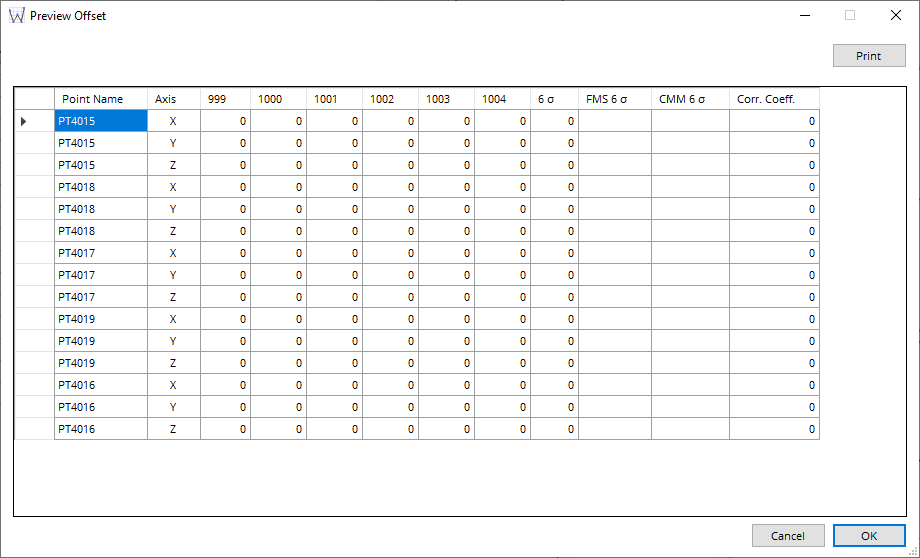
Preview Offsets: Shows a summary of the offset results based on the correlation results.

Display: Shows a line graph of the results for the selected point for each cycle.
Note
outliers of FMS data only can be removed from the graph. This will slightly adjust the offset calculations.
Control: Shows the Upper and Lower control limits in the Display.
Spec.: Shows the Upper and Lower Spec limits in the Display.
Select Next to go to the next step, or Back to go to the previous step.